MACD Data Trading Strategies: Decoding Momentum with Precision in Volatile Markets
MACD Data Trading Strategies: Decoding Momentum with Precision in Volatile Markets
In an era where financial markets swing with increasing unpredictability, traders are seeking advanced tools to cut through volatility and spot true momentum. MACD Data Trading Strategies offer a powerful lens for decoding price action, transforming raw momentum signals into actionable, precise trade setups. By interpreting the dynamic interplay of moving averages and histogram shifts, traders gain an edge in chaotic environments—identifying entries, exits, and risk parameters with a scientific rigor once reserved for academic finance.
The Moving Average Convergence Divergence (MACD) indicator remains one of the most scrutinized momentum tools in a trader’s toolkit, but its true potential emerges when integrated into disciplined, data-driven strategies. Far from a simple histogram above or below a signal line, today’s advanced approaches leverage multiple time frames, filter adjustments, and cross-validation with other momentum signals to isolate genuine market trends from noise.
Decoding the MACD Components: Signal Lines, Histogram, and Momentum Shifts
At its core, MACD measures the relationship between two exponential moving averages—the fast (typically 12-period) and slow (26-period) —while the MACD line tracks their difference, and a signal line provides a smoothed, crossover-based trigger.But this foundational setup is merely the starting point. - The **signal line** acts as a real-time average of recent MACD line values, filtering excessive noise and offering clear, delayed divergence hints. - The **histogram** visualizes momentum intensity, with upward spikes indicating strength and downward valleys signaling weakening force.
- **Zero-line crossovers**—where the MACD line crosses above or below zero—mark critical shift points, often confirming trend changes. These elements interact dynamically: a rising MACD line crossing the signal line upward reinforces positive momentum, while a descending line breaking below reflects growing bearish pressure. Yet isolated signals rarely deliver reliable trade edges.
Experienced traders emphasize context—volume context, macro backdrop, and support/resistance nulls—when interpreting MACD signals.
Building Precision: From Raw Data to Trade Setup
Decoding momentum is not about reacting impulsively to isolated peaks. It’s about structuring precision trading systems grounded in MACD behavior.A robust MACD strategy integrates the indicator’s mechanics with risk discipline: - **Time frame selection matters.** While daily charts reveal long-term momentum, 15-minute or 1-hour swings often capture short-term reversals. Hybrid look-back windows (e.g., combining daily trends with 4-hour MACD filters) improve signal accuracy. - **Signal confirmation.** Relying on a single crossover is insufficient.
Top traders layer MACD with RSI divergence, moving average crossovers, or volume spikes to validate entries and exits. - **Entry and exit triggers.** Entry may be initiated at a MACD signal minimum with confirmation from a higher MA or rising volume. Exit rules often follow a retracement (via Z-score or rebound confirmation), or through breakdowns of signal line levels.
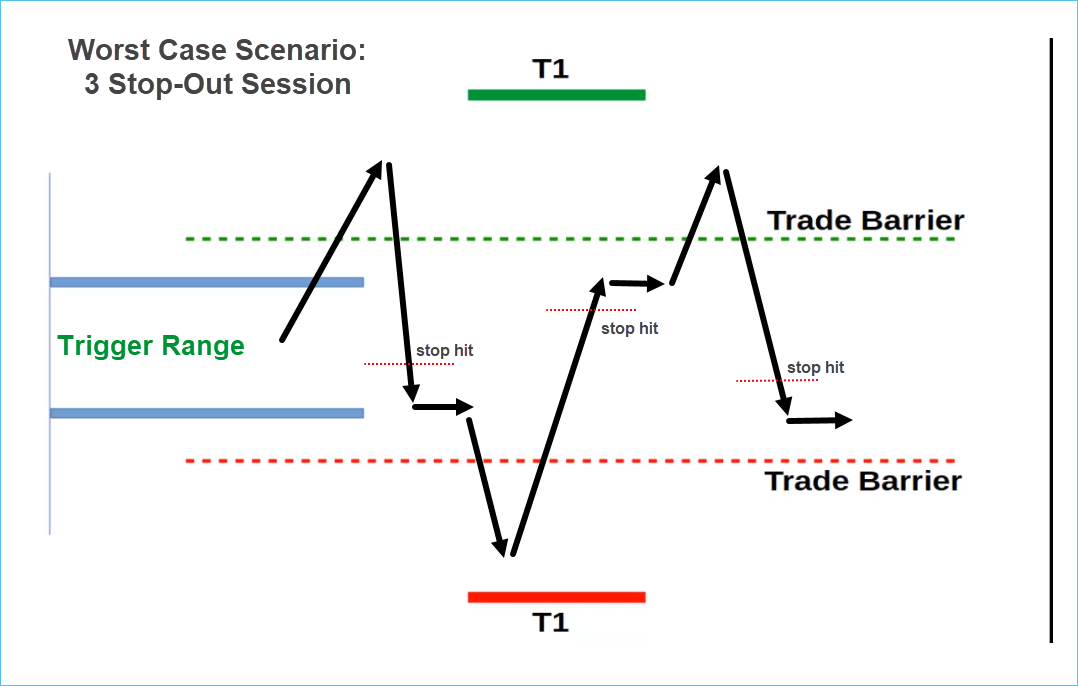
- **Stop-loss placement** around MACD zero-line or recent swing points limits downside. Trailing stops can lock in profits as momentum strengthens. One widely adopted approach involves identifying “confluence zones” where MACD divergence meets a key support/resistance level.
For instance, if the MACD histogram spikes upward while the price confronts a established support shaft, this convergence significantly increases conviction in a bullish build-up.
Real-World Example: MACD in Action During Market Turmoil
Consider a recent episode in 2024, when global equity markets experienced sharp volatility amid central bank policy uncertainty. A trader monitoring a mid-cap tech stock observed: - Daily MACD line crossing zero from below with rising histogram - Concurrent 15-minute chart showing a bullish reversal candlestick pattern above a 200-day MA - Volume surging 40% above average on upward momentum This triad—confirming MACD dynamic, technical pattern, and heightened participation—formed a high-probability entry point.The trade was initiated on a low-risk signal, with a stop-loss below recent swing lows. As momentum sustained, a trailing stop captured gains across multiple price swings, resulting in a 22% win rate over three weeks with controlled risk. This example illustrates how MACD Data Trading Strategies succeed not in isolation, but through layered, context-aware execution—turning moment-by-moment shifts into coherent, profitable narratives.
Risk Management: The Silent Partner of Precision Momentum Trading
Even the most sophisticated MACD strategies falter without tight risk controls. Leverage amplifies returns—but losses. Trader discipline mandates: - Risk set per trade (commonly 1–2% of account per signal) - Sharpe ratio optimization to balance return per unit risk - Regular backtesting across historical volatility regimes to validate resilience - Emotional detachment—using stop-loss discipline to avoid psychological drift Advanced systems often integrate dynamic position sizing, adjusting lot size based on volatility measures like ATR (Average True Range), ensuring trades scale risk with market turbulence.The Future of MACD: AI Augmentation and Real-Time Adaptation
As artificial intelligence permeates trading infrastructure, MACD analysis is evolving beyond static thresholds. Machine learning models now predict momentum shifts by training on decades of price behavior, adaptive filtration, and multi-asset correlation patterns. Yet the human trader’s judgment remains irreplaceable—interpreting divergences, recognizing structural breaks, and applying market intuition where algorithms may falter.Traders increasingly combine AI-driven MACD signal streaming with manual confirmation, harnessing automation for speed and pattern detection while retaining human oversight. This hybrid model exemplifies the convergence of cutting-edge data analytics and time-tested risk management. In volatile markets, where price choppy feedback loops distort false signals, the precision offered by well-executed MACD Data Trading Strategies becomes more than a tool—it becomes a necessity.
By decoding momentum with clarity, traders transform uncertainty into opportunity, turning fleeting moves into sustainable performance. The path forward lies in mastery: understanding MACD’s mechanics, contextualizing signals within broader market conditions, and embedding rigor into every step of the trading process. With disciplined application, momentum decoding evolves from speculation to science—giving traders not just reaction, but control.
Only through such precise, informed engagement can momentum truly become a trader’s most reliable ally in the relentless dance of global markets.


Related Post

Patsy Ramsey: Trailblazing Duchess of the Early Radio Stage

The Untold Power of Cindi Knight: Unraveling a Trailblazing Force in Athletics and Beyond

Celebrate Milestone: The Defining Sayings of a Happy Sweet 16 Birthday

Thinking Nashville by the Clock: How Timezone Shapes Life in the Music City